Workshop 3: the global division of labour
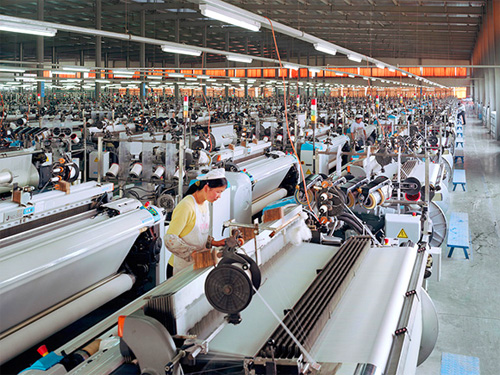
Textile mill in Xiaoxing, Zhejiang Province, China. 2004.
In 2011 China became the world’s largest producer of manufactured goods. Overtaking the United States, the biggest producer for the last 110 years. China, India, and other Asian countries are now the “factories of the world”, the main centres of production for most of the tangible things we buy and use, from cars to computers to crockery. Just as they were 200 years ago before European capitalist expansion.
Other “developing countries” in Latin America, Africa, the Middle East, as well as Russia, provide most of the basic raw materials – fuel, metals, minerals, etc. – to run those factories. The “developing world” – or should we now call it “the productive world”? – also produces most of the world’s food.
But all this wealth is still largely consumed in Europe and North America. How does that work? And how long can it carry on?
……
A recap.
Capitalists chase profit. They can make profit “directly” by producing and selling commodities. Or “indirectly” by getting interest from investing finance capital; or by acting as middlemen, for a fee.
Profit = revenues – costs. So to boost profits producers need to increase revenues, or reduce costs. To increase revenue they need to find higher demand for their products: more buyers; or buyers who will pay more. There are two main routes to reducing costs: more efficient production technologies; or cheaper inputs. New inventions and technological advances boost profits and production. So do finding new sources of cheap materials – or cheap labour.
So the hunt for profits drives the expansion of capitalism in a number of ways, as capitalists try to find or create new markets. New consumer markets to buy their goods; new sources of raw materials; and new sources of cheap labour.
……
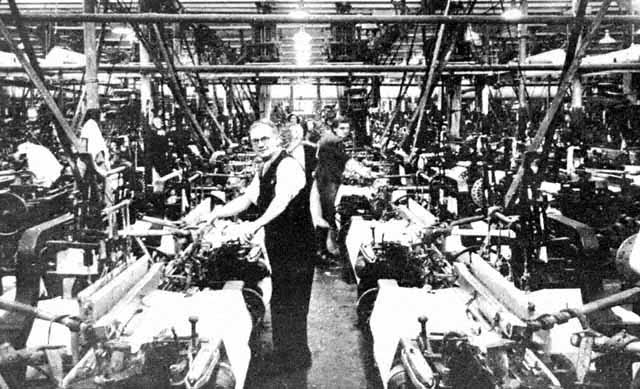
Textile mill in Blackburn, Lancashire, UK.
Global incomes.
The table below shows some of the global income statistics estimated (or “guesstimated”) by the economic historian Angus Maddison. They calculate income as GDP per person (annual income measured in 1990 dollars).
| 1 AD | 1000 | 1500 | 1820 | 1900 | 1970 | 2008 | |
| W. Europe | 576 | 427 | 771 | 1194 | 2885 | 10,169 | 21,672 |
| US | 400 | 400 | 400 | 1257 | 4,091 | 15,030 | 31,178 |
| Ex USSR | 400 | 400 | 499 | 688 | 1237 | 5,575 | 7,904 |
| L. America | 400 | 400 | 416 | 691 | 1,113 | 3,996 | 6,973 |
| China | 450 | 466 | 600 | 600 | 545 | 778 | 6,725 |
| India | 450 | 450 | 550 | 533 | 599 | 868 | 2,975 |
| Africa | 472 | 425 | 414 | 420 | 601 | 1,335 | 1,780 |
| World Average | 467 | 453 | 566 | 666 | 1,261 | 3,729 | 7,614 |
Of course, these figures are mostly just rough guesses, and ignore massive differences in economic systems, including what would be considered as tradeable “commodities” at all. But they at least bring out some basic points. If we measure prosperity in terms of the sheer quantity of tradeable stuff around, then the world has got much richer under capitalism. Average incomes around the world stayed pretty much the same in the centuries before the industrial revolution and capitalist take-off. China had more stuff that Europe in the millenium or so after the fall of Rome, but not dramatically more.
Then it all took off. In the early nineteenth century European and North American income was double the levels in the rest of the world. But this was just the beginning. By 1900 the US produced seven times more (per person) than China. By 1970 it produced 20 times more.
World income has doubled again since 1970. This includes the “developed world”. But the most growth is in Asia: China has grown nine times richer, India four. Only Africa has been left out.
……

Map resizing countries by proportion of world GDP — from http://www.worldmapper.org/
GDP?
GDP stands for “gross domestic product”. Roughly, it means the value of all the goods and services produced in a country. Economic growth is the increase in a country’s GDP over time. GDP per capita is the country’s GDP divided by the number of people in the population: i.e., the average GDP.
Economists use GDP as the standard measure of economic wealth and prosperity. And, often, as the measure of all goodness and “progress” in the world.
Focusing on GDP ignores many issues. Average GDP figures ignore the inequality of income distribution within a country. GDP statistics ignore unpaid and unseen work: including domestic work, largely done by women; or “black” work, like the work of illegal migrants. Using GDP as a measure of goodness or “quality of life” supposes that our well-being just involves accumulating and consuming commodities.
Why is economic growth the one great goal of democratic politics? Policies that chase growth certainly help capitalist profits. And they avoid questioning the distribution of wealth: if everyone gets richer as the economy grows, we can all have more stuff without having to take it away from the rich. Questioning the distribution of wealth is labelled the “politics of envy”. Questioning the very idea of economic growth, or what never-ending increased production means for our planet, is just crazy talk. (We will look at this issue again in Workshop 6).
……
What explains global income inequalities?
Neoliberal economists argue that it is all about the internal systems of countries. “Poor” countries (Latin America, India, Africa, etc.) have failed to keep up with world growth because of weak institutions: corruption, weak democracy, and above all a lack of strong property law. (The Peruvian economist Hernando de Soto is the master of this line – see his “The Mystery of Capital”.)
So is it just a coincidence that these “poor” economies used to be colonies of the successful capitalist nations?
……
Core and periphery
According to the “world systems theory” of capitalist development, political-economic systems typically have a core and a periphery.
The core is where high-technology, high-skilled, capital-intensive, production happens. These are usually the later stages in the production process. The periphery produces the raw materials which are shipped to the core. Some of the finished goods may then be shipped back to consumers in the periphery. The core is also where trading and organisation functions, such as financial markets, are based.
This division of labour makes the periphery dependent on the core: it cannot produce the finished goods on its own. Strictly speaking, core and periphery are dependent on each other. But the core has the advantage as its goods are more specialised, harder to produce, more valuable.
……
Imperial history
In pre-capitalist civilisations, and in early capitalist Europe, commercial cities were cores, producing and trading the advanced goods; the local countryside was their periphery.
Colonialism mader core/periphery systems go global. In the 19th century, Britain was the biggest “core” of the global trade system. Its products involved skilled labour, for (relatively) high wages, and advanced technology. It was also the site of the financial markets.
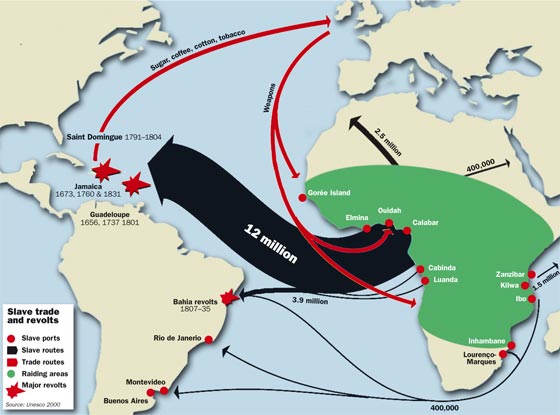
The “periphery” of the empire produced the raw materials. The United States was originally settled as a mass grain producer for the Imperial market. India’s own cotton maunfacturing industry was destroyed, and India became an intensive producer for raw cotton shipped to the mills of Lancashire. The Atlantic Slave Trade and Indentured Labour provided cheap (or free) labour for agriculture and raw materials production.
How did Britian become dominant? Britain’s initial advantage came from new technologies: not only cotton mills and steam engines, and new weapons; but also new financial, legal, and cultural “technologies”. Technology gave British industrialists a competitive advantage – they could produce better goods, more cheaply – and their manufactured products took over world markets.
Where capitalists in other countries could not compete with British manufacturing, their profit opportunities came from exploiting cheap labour and natural resources to produce raw materials. So the local capitalists – plantation and mine-owners, etc. – of periphery countries also gained in the core/periphery division.
Imperialism involved both market power and military power working together. Technological advantage gave the British capitalists their initial market power. As they accumulated wealth and capital, market power was further increased by the sheer size of their resources.
The British state used its share of this accumulated wealth to create the world’s most powerful military machine. Business and government worked together to “open” new markets and property systems with a mixture of trade and force. This did not always require direct colonisation: e.g., in the Opium Wars, and the smashing of the Boxer Rebellion, Britain and other capitalist states forced the Chinese government to allow the trade in opium and other goods.
Nor should we ignore cultural power: missionaries, doctors, teachers, and other settlers, spread the new values, norms, and desires of the capitalist property system.
……
Hegemony?
The greek word hegemon (ruler, leader) is sometimes used for a state like Britain in the 19th century, or the US and USSR in the 20th, which dominates world politics and economics.
But this concept shouldn’t be over-used. In the 19th century, there were large areas of the world still uncolonised. For much of the 20th century there were two main rival powers. Even on its own home turf, a state or elite’s power is never total: there are competing factions and interests within the elite; and free spaces and pockets of resistance where power is much weaker.
……
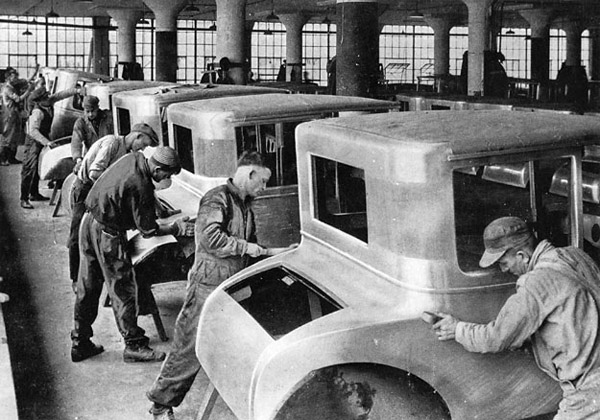
Ford assembly line in 1927.
Moving up.
How can a country move from periphery to core? The problem is that advanced manufacturing production needs serious capital investment: factories, complex machines, energy plants, transport infrastructure, etc. These advanced goods are very profitable – but you need massive investment to get started. And that is assuming core producers play fair and allow access to advanced technologies and markets.
In the early 19th century the US was still a periphery country, producing grain and cotton for the British empire. But this was profitable business, and US capitalists were able to build up a surplus of finance capital for investment. They started to invest it in building up local manufacturing industry which could eventually compete with Britain. Some of the reasons they succeeded were:
- they had big enough capital reserves for the initial investment;
- new technologies – including “Fordism”, the production line methods pioneered by Ford Motors — gave them an advantage;
- whereas Britain was stuck in old technologies – and with all their existing infrastructure in place, it was expensive for British capitalists to switch to copy the new American models;
- cheap labour from mass immigration, whilst British labour was getting more expensive, due to workers’ political organisation;
- alongside the development of manufacturing, the US state and capitalists built up local financial markets, so that industrialists didn’t have to go to London to raise money;
- protectionism – the US government offered support to domestic industry by imposing high taxes (trade tariffs) on imported goods;
- but protectionism is only possible if existing core states allow it – the decline of British military power meant the empire was too weak to use force to defend “free” markets for its goods.
……
“Kicking away the ladder.”
In the 1950s and 60s, “third world” states in Latin America and Asia tried to follow the US example and use protectionist policies to develop national manufacturing industries. This policy was known as “Import Substitution Industrialisation (ISI)” – building industry to substitute local products for imports of advanced goods. They used import tariffs and state subsidies to “nurture” “infant industries”.
ISI largely failed. These countries were not strong enough, economically or militarily, to take on the US. If they introduced import tariffs, core countries could retaliate with tariffs attacking their exports. Most of their income still came from exports, and local consumer markets could not fill the gap. The rich elites could afford to buy better quality imported luxuries. Most locals were just too poor to buy anything.
If these trade wars weren’t enough to keep third world states in their place, the US could resort to other means. Across Latin America in the 1970s, the US launched coups to impose governments that dropped ISI and kept to their place as raw material exporters. (See William Blum’s “Killing Hope” for a bloody history of US military interventions since 1945).
……

Dharavi slum, Mumbai. Rapid industrialisation means rapid urbanisation.
The price of our blood, sweat and tears.
GDP averages hide the vast inequalities within countries. And inequality in “third world” countries is typically more extreme than in “developed countries”, where worker organisation has gained some victories – higher wages, and welfare services.
Here are some figures on average hourly wages in manufacturing industry, as estimated by the US Bureau of Labor Statistics.
| Germany | $26.90 |
| US | $23.03 |
| UK | $21.14 |
| Greece | $10.38 |
| Brazil | $4.45 |
| Mexico | $3.93 |
| Philippines | $1.13 |
| China | $0.81 |
Note: data from 2010, except China from 2006.
Manufacturing wages in the US and Western Europe are more than 20 times higher than in China.
……
Investment vs. consumption.
We saw before that US GDP per head is 4 to 5 times higher than in China. So, most of China’s high growth is not paid out as factory wages. Some of it goes into the pockets of China’s “new rich”. Most of it, though, is not consumed but invested back in production. Spent on new capital: new factories, new machines, more raw materials and energy, to produce even more stuff.
GDP is, effectively, the total revenue from all the production of a national economy. As we saw in workshop 1, some of the revenue of a capitalist production process goes to cover the costs: wages (labour costs); raw material costs; and finance costs (interest payments). The rest is the producer’s profit. Out of the profit, the capitalist has to decide how much to invest on future production; and how much to “consume” herself.
We can do the same kind of breakdown on a bigger (national) scale. GDP is the (money) value of all stuff produced in a national economy. Some of that stuff will go to workers, as wages. Some will go to investors, as interest and dividends. Some will go abroad (exports). Some will go to the government, in taxes from workers and investors and on exports.
There are two things that workers, investors, and governments can do with their share of the national product. They can consume it, or save it.
Consumption? Roughly: if a commodity is consumed, it is taken out of economic circulation. If I eat (consume) a chocolate bar, it leaves the economy and enters my belly. It can no longer be traded, or used as raw material for a chocolate cake.
Alternatively, I can hide the chocolate bar under my bed for a rainy day. This is a form of saving. But, on the whole, most people with money with money don’t save it by hiding it under the bed. They either deposit it in banks, who then lend it on; or invest it in shares, bonds, and other markets. These forms of saving thus involve re-investing capital, through financial markets, back into production. Thus a basic assumption of macroeconomic theory: Savings = Investment.
The share or percentage of income that is saved and invested is called the savings rate. There is a lot of discussion amongst economists about how people make “savings decisions”. Generally speaking, the more income people have, the more they are likely to save. If your wages are near starvation level, you will spend everything on food.
Here are some figures on national savings rates (as a percentage of GDP):
| 1990 | 2000 | 2008 | |
| China | 39.2 | 36.8 | 54.3 |
| India | 23 | 23.8 | 33.6 |
| Mexico | 23.6 | 23.8 | 25.5* |
| UK | 16.4 | 15 | 15.6 |
| US | 15.3 | 17.7 | 12.1 |
| Germany | 25.3 | 20.2 | 26 |
(Source: Bank for International Settlements; *data for 2006.)
People in China and India are, on average, much poorer than people in the UK and Europe. If China’s income were distributed equally amongst Chinese population, economic theory would predict that they would consume more than save. But, luckily for China’s rapid economic growth, this doesn’t happen. Besides the “new rich”, who do their best to spend at least some of it on luxury living, China’s income is largely controlled by the State and state-linked corporations, who pursue a policy of investment and growth.
……

Global shift.
We made a list of some of the reasons why the US was able to successfully escape its “periphery” status and overpower British and hegemony. Now we can see how China, and also India and other former “third world” economies, fit the picture.
- investment capital – accumulated through high national savings, largely centralised and controlled by the State and mega-corps;
- cheap labour: millions of impoverished rural labourers flocking to the cities in search of work, in scenes reminiscent of the birth of Industry in Europe, only on a much bigger scale;
- new technologies: production line industry taken to a new scale;
There are also differences. China and India do not follow the import substitution model. Their manufacturing is mainly for export. Local consumer markets are developing, but not fast enough to keep up with production. (Which is why Chinese capitalists are still at risk from the global depression – they need us to keep consuming their products.) Their products directly out-compete manufacturing in the old core, mainly due to much lower wage costs. So they do not need to rely on protectionist import tarriffs.
What does benefit them is to keep their own currencies low, making exports even cheaper. The trade wars rumbling between China and the US have been about currency “manipulation” not protectionism.
China has been winning these trade wars. The US now has neither the market power nor the military power to take on China. Like Britain 100 years eago, it has burnt out its economic and military resources maintaining a dying empire, getting caught in costly and pointless wars. All the old hegemon can do is grumble.#
……
Once more, financialisation.
US economic independence from Britain also involved the development of financial markets in New York and Chicago to rival London. New financial centres – particulary Hong Kong, but also local markets elsewhere in Asia, and in Latin America – are developing.
But what’s interesting is that the markets in London and New York have been growing even faster. “First world” GDP has been growing much slower than in the “emerging markets”; “first world” manufacturing is in decline; the only part of the first world economy that races ahead is finance.
A couple of things really show the shift towards finance in countries like the US and UK. One is where profits come from (source: Foster & Magdoff).
- 1960s: financial profits were 15-20% of all profits in the US;
- 2000s: they were 35-40%.
The other is the work people do. Here are some recent employment figures from the UK (source: Turner; Office for National Statistics):
| Manufacturing | Financial, business service, and insurance | Retail, hotels and restaurants | |
| 1997 | 4.2 million jobs | 4.9m | 4.9m |
| 2007 | 2.9m | 7.15m | 7.1m |
The famous “destruction of British manufacturing” which started under Thatcher continued apace under Labour. By 2007, over 7 million people were working in finance. Another 7 million people were making them cappuccinos.
……
Vendor financing.
The question: if US and UK industry has died or, at best, stagnated, what are these bloated financial markets actually financing?
The answer: a massive consumer debt bubble.
How does the first world pay for all those imported goods? By borrowing from the productive world.
(To be continued in Workshop 5).
……
Further reading:
Herman Schwartz States vs. Markets is a good general introduction to World Systems Theory (WST) and global political economy.
The godfather of WST is Immanuel Wallerstein.
Ha-Joon Chang’s Kicking Away The Ladder looks at how industrialised nations use protectionism to grow their nascent industries, then “kick away the ladder” to stop others copying them.
For a brazen neoliberal “institutionalist” theory of development and inequality, which comes recommended by Reagan and Thatcher, see Hernando de Soto’s The Mystery of Capital. It’s really worth reading.
On the iron fist of the invisible hand: William Blum “Killing Hope” – a history of US military and clandestine interventions since 1945. www.killinghope.org and to download here: sandiego.indymedia.org/media/2007/02/125025.pdf.
On the crisis and the current global shift see: Graham Turner The Credit Crunch; Paul Mason Meltdown; and other references in Workshop 5.
The mainstream sources for global income etc. stats are the research and data departments of the IMF, World Bank, and OECD (“Organisation for Economic Cooperation and Development”).
Angus Maddison’s stuff is here: http://www.theworldeconomy.org/